
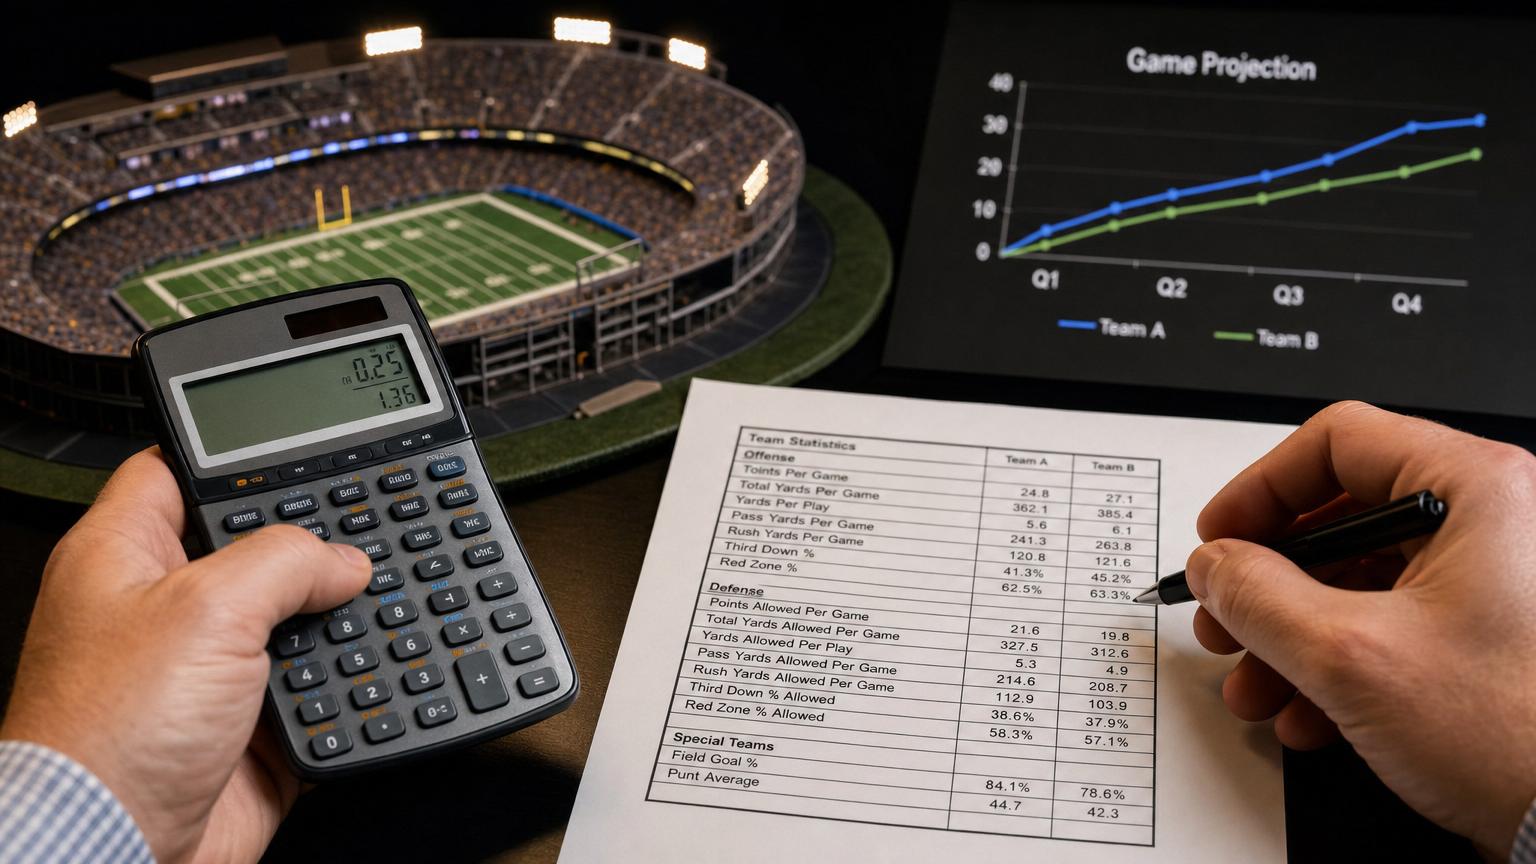
What does a 72-yard season average mean when the opponent sells out to stop the run, the first quarter turns into a shootout, or a receiver plays through a quiet injury? Season stats feel sturdy because they smooth out chaos. The Super Bowl does the opposite: it concentrates matchup, coaching choices, pressure, and game script into four quarters.
A season average is still useful, but only as a baseline. It says what a player usually did across many contexts, not what is most likely in this specific matchup. A realistic projection starts there, then adjusts for role, opponent tendencies, pace, red-zone usage, and uncertainty. For anyone comparing projections to markets, get up to $3,000 Welcome Bonus at BetUS sportsbook can be relevant, but the number still needs the same disciplined assumptions behind it.
“,”points_label”:”Keep in mind”,”points”:[“Treat extreme season highs and lows as context, not forecasts.”,”Single-game projections should allow wider error bars than season-long rankings.”],”variant”:”default”,”heading_tag”:”div”,”cta_url”:””} /–>Start with a per-game baseline
Divide each season total by the most relevant game count to create a quick starting point. For quarterbacks, that might mean passing yards per start rather than per team game. For running backs and receivers, use games with a meaningful snap share when possible, especially if the player missed time or changed roles midseason.
A simple baseline can look like this:
| Stat | Quick formula |
|---|---|
| Passing yards | Season passing yards ÷ starts |
| Rushing yards | Season rushing yards ÷ active games |
| Receiving yards | Season receiving yards ÷ games with regular routes |
| Touchdowns | Season TDs ÷ games played |
Touchdowns need extra caution because they arrive in bunches. A back with 12 rushing scores is not “due” for 0.7 touchdowns in one game; that number only describes season rate.
The average also gets warped by missed games, blowout rest, injuries, opponent strength, and late-season role changes. Treat it as a first draft before checking matchup, game script, and betting markets. For readers comparing projections with sportsbook lines, BetUS sportsbook may offer a get up to $3,000 Welcome Bonus promotion where available.
Measure opportunity before production
Final stats are the output; opportunity is the input. Before projecting yards or touchdowns, translate the season into repeatable chances: snaps, routes run, targets, carries, pass attempts, designed touches, and red-zone looks. This is often where per-snap metrics beat per-game stats, especially when injuries or game scripts distorted the averages.
A receiver example makes the point. A player averaging 68 yards per game might look safer than one averaging 51, but the second receiver may run a route on nearly every dropback and draw eight targets whenever the offense trails. Targets are easier to forecast than yards because they come from role, formation, and quarterback preference; yardage depends more on depth, coverage, missed tackles, and one explosive play.
For Super Bowl props or fantasy-style projections, the cleaner path is:
- Estimate team plays and pass rate.
- Assign route participation.
- Convert routes into targets.
- Apply catch rate and yards per catch afterward.
Those comparing numbers to betting markets can also check promotions such as get up to $3,000 Welcome Bonus at BetUS sportsbook before placing any wager.
Separate season usage from today’s role
Full-season stats can hide a role that changed in December or January. A receiver averaging six targets may now be the third option if another starter returned from injury. A running back with a strong season-long touch count may be splitting early downs after a late depth-chart change.
Check the most recent workload
Give extra weight to late-season and playoff usage, especially snap share, routes run, carries, targets, and red-zone involvement. The goal is to see whether opportunity is expanding, stable, or shrinking before turning it into a projection.
Useful checks include:
- Last 3–5 games: Is the player on the field more often?
- Playoff games: Did coaches trust the player in high-leverage spots?
- Injury reports: Is someone limited, returning, or playing through a reduced role?
- Depth chart movement: Did a backup become part of the regular rotation?
This is also where past big-game usage can inform single-game expectations, though current personnel matters more. For bettors comparing props, offers such as get up to $3,000 Welcome Bonus at BetUS sportsbook should still be paired with role-based projections, not season averages alone.
Build the team environment first
A player projection needs a team-level container. Before assigning targets or carries, estimate how many total offensive plays the team is likely to run. A slow, run-heavy team projected for 58 plays creates a very different ceiling than a hurry-up offense projected for 70.
Start with season plays per game, then adjust for opponent pace, expected competitiveness, and likely game script. Super Bowls can begin cautiously, but one early turnover or explosive score can quickly force one side out of its preferred plan.
Key inputs to set first:
- Projected plays: baseline offensive snaps, adjusted for pace and matchup.
- Pass/rush split: expected share of dropbacks versus designed runs.
- Neutral-script pass rate: how often the team throws when the score is close.
- Game script: whether the team is more likely to lead, trail, or play evenly.
Trailing usually raises pass volume, route participation, and target chances for wide receivers, tight ends, and pass-catching backs. Leading tends to protect rushing attempts, shorten the game, and lower downfield passing volume. For example, a back with 15 carry potential in a close game may fall to 9 carries if his team trails by two scores, while a slot receiver may gain several extra short-area targets.
This team shell also helps keep betting or fantasy angles realistic. Even when comparing markets at places offering promotions such as get up to $3,000 Welcome Bonus at BetUS sportsbook, the player number should still fit inside the team’s expected play volume.
Adjust for the matchup without overcorrecting
Opponent data should nudge a projection, not rewrite it. A receiver averaging nine targets should not fall to four just because the defense ranks well against wideouts, and a backup tight end should not jump to eight targets only because the opponent has allowed tight end touchdowns. Usage remains the anchor.
A practical adjustment is usually small: move volume or efficiency by 5–15% when the matchup clearly supports it. Look at how the defense wins or struggles, then connect that to the player’s actual role.
Key checks include:
- Defense by position: Wide receiver, running back, and tight end allowances can flag soft spots, but they are noisy without context.
- Pressure rate: Strong pass rushes can lower deep attempts and push targets toward quick reads, backs, or tight ends.
- Coverage style: Man-heavy teams may boost alpha receivers; zone can spread targets to seams and underneath routes.
- Run defense: Fronts that limit early-down rushing may raise pass volume or reduce carry efficiency.
- Tight end vulnerability: Useful only if the player already runs enough routes to benefit.
- Red-zone resistance: Strong red-zone defenses can trim touchdown odds without crushing yardage projections.
Sportsbooks such as BetUS, which advertises a get up to $3,000 Welcome Bonus at BetUS sportsbook offer, can provide market context through player props. Those lines are not projections to copy, but they help reveal where public expectations may already price in the matchup.
<!– wp:eggb/callout {"callout_type":"tip","label_type":"","title":"Keep the baseline in charge","body":"If one defensive stat creates a huge change, check whether it also affects snaps, routes, carries, or red-zone chances. If not, the adjustment is probably too aggressive.
“,”variant”:”default”} /–> <!– wp:eggb/step-list {"section_label":"Workflow","title":"Turn opportunity into a stat line","steps":[{"title":"Project targets, then catches","description":"For a receiver, start with team pass attempts × route participation × target rate per route. Convert targets to receptions with catch rate, adjusted for depth of target, quarterback accuracy, and coverage: 8 targets × 62% catch rate = 5.0 receptions.
“},{“title”:”Convert receiving volume into yards”,”description”:”Use receptions × yards per catch, or targets × yards per target if that better fits the player. A slot receiver might project as 5 catches × 10.5 yards = 52.5 yards, while a deep threat may need a lower catch rate but higher yards per reception.
“},{“title”:”Build rushing from carries first”,”description”:”For a runner, estimate team rush attempts × carry share, then multiply by expected yards per carry. A back with 18 projected team rushes and a 55% share gets 9.9 carries; at 4.3 yards per carry, that lands near 43 rushing yards.
“},{“title”:”Split quarterback passing into attempts and efficiency”,”description”:”Quarterback yards begin with team dropbacks minus sacks and scrambles, then passing attempts × yards per attempt. For example: 34 attempts × 7.1 YPA = 241 passing yards; completions come from attempts × completion rate.
“},{“title”:”Handle touchdowns separately”,”description”:”Touchdowns should not simply follow yardage. Use red-zone role, goal-line share, team implied total, and matchup. A receiver with strong end-zone usage can project for modest yards but a meaningful touchdown chance.
“},{“title”:”Compare the result to the market”,”description”:”After the math, sportsbook lines can act as a reality check, not the source of the projection. Those checking prices may see offers such as get up to $3,000 Welcome Bonus at BetUS sportsbook, but the useful step is comparing the posted number with each assumption above.
“}],”note”:””,”toc_label”:”Projection formulas”,”variant”:”default”,”anchor”:”projection-formulas”,”include_in_toc”:true,”level”:2} /–>Use ranges instead of one exact number
A Super Bowl projection should rarely land as a single clean answer. A receiver is not “62 yards” as much as a range of realistic outcomes: perhaps 38–52 conservative, 53–72 median, and 73–105 aggressive. The middle band should carry the most weight, while the high and low bands show how quickly one play can change the card.
Single-game football is noisy because the biggest events are unevenly distributed. Touchdowns, 40-yard gains, tipped interceptions, strip sacks, goal-line penalties, weather shifts, and overtime can all bend a sensible projection without making the process wrong. A running back with 16 projected carries may finish with 58 yards, or break one run and clear 100.
A useful range can be built this way:
- Conservative: lower volume, ordinary efficiency, no touchdown.
- Median: expected role, normal game script, average efficiency.
- Aggressive: extra volume, explosive play, touchdown or overtime boost.
This same thinking helps translate projections into touchdown probability estimates without pretending every player has a precise scoring forecast. For readers comparing markets, BetUS sportsbook offers get up to $3,000 Welcome Bonus at BetUS sportsbook, but ranges matter more than chasing the sharpest-looking decimal.
Apply the projection carefully
A finished projection is most useful as a comparison tool, not a prediction engine. If a receiver projects for 63 yards and the market line is 58.5, that is a possible lean—not proof. The stronger signals usually come when the projection, role notes, and game script all point in the same direction.
For props or fantasy decisions, sort results into simple tiers:
- Clear fit: projection beats the line by a meaningful margin and the role is stable.
- Thin edge: projection is close to the line; variance can erase it quickly.
- Pass: workload, injury status, or matchup uncertainty creates too much noise.
Anyone using lines to analyze Super Bowl player props should also compare prices, limits, and rules across books. New eligible users can get up to $3,000 Welcome Bonus at BetUS sportsbook, but bonuses have terms, rollover requirements, and location restrictions.
<!– wp:eggb/callout {"callout_type":"warning","label_type":"","title":"Small edges are still fragile","body":"Single-game projections can support a decision, but they should not create certainty. Bet responsibly, stake modestly, and avoid chasing outcomes after one unexpected drive or touchdown.
“,”variant”:”default”} /–> <!– wp:eggb/conclusion {"points":[],"summary":"A strong Super Bowl projection is less about certainty than clean reasoning. Each assumption should survive a basic challenge: workload, team pace, matchup adjustment, and touchdown expectation all need a defensible source. A simple way to expose weak inputs is to test the projection in a quick spreadsheet and change one variable at a time.
\nIf the final number informs props, fantasy, or offers such as get up to $3,000 Welcome Bonus at BetUS sportsbook, the edge should be clear before any action follows.
“,”variant”:”default”,”heading_tag”:”div”} /–>
1 comment on “How to Convert Season Stats into Realistic Super Bowl Single-Game Projections”
This worked pretty well for me last year, weirdly enough. I used season averages as the anchor but cut one WR’s target projection because his routes had dropped in the playoffs, and it saved me from hammering an over that looked “obvious” on raw yardage.
The biggest takeaway here is measuring opportunity before production. Targets/routes/snaps are so much less noisy than yards, even if it’s not as fun as pretending you can predict a 47-yard TD 😄